Data Science
Twitter Content Analysis of Various Armed Forces
Work done under Dr. Amit Awekar at IIT Guwahati
In our work, we analyze and carry out a systematic comparison of social media presence of seven major national armies including India, USA, Pakistan, Australia, Russia, France and Britain and perform in-depth analysis for their verified Twitter handles. We analyze the structure of the tweet, topics discussed by each army handles and the type of content discussed in the tweets.
Highlights
- Analyzed Max Retweet day, Content of Top Tweets, Interactive Measure, Top Hashtags and User Mentions.
- Performed Topic Modeling using Twitter-LDA models.
- Classification of tweets into 6 categories based on their content mainly Deaths, Promotions, Important Day, Humanitarian Work, Current Affairs and Miscellaneous using rule-based learning, Convolutional Neural Network, Recurrent Neural Network and Hierarchical Neural Network.
- Studied the information diffusion of these handles and also generated the time after which retweet count approaches long tail. This basically means that tweet gets a negligible number of retweets after this time and becomes irrelevant.
Tags
Python, scikit-learn, Tweepy, Numpy, Matplotlib, Pandas, NLTK, Keras, Jupyter Notebook, BeautifulSoup, Java, java-common.
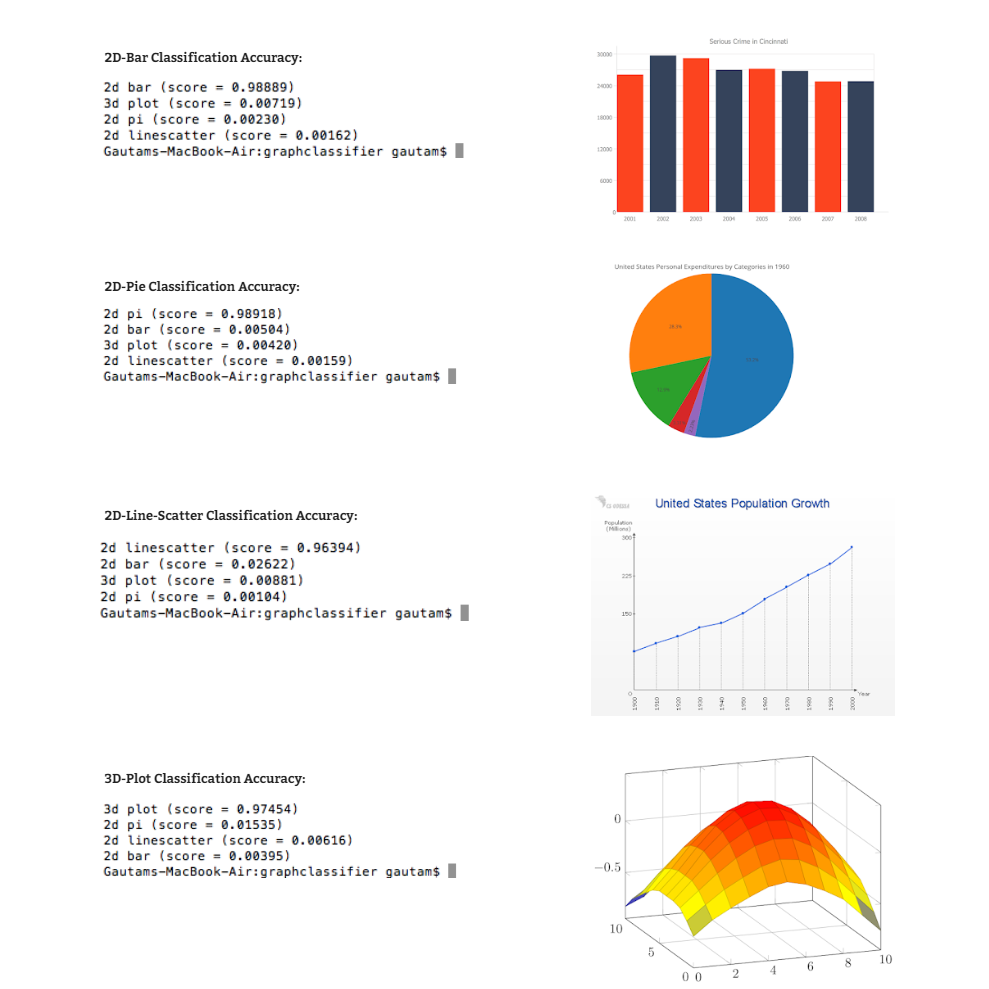
D-Grafica: Extensive Summarization of Data Images
A Data-Chart Classification, Extraction and Summarization program that uses TensorFlow, MATLAB for IP and text recognition and a pre-trained Deep Learning Convolutional Neural Network model called Inception (V3). It also helps in reconstructing them with the original data values and produce better search results.
Highlights
With Google, we extract over 6000 visualizations, and classify them with 90% accuracy, across 12 visualization types.
Tags
Python, Tensorflow, Tkinter
Information Extraction from Scientific Data Charts
It is an Image-Processing application for the automatic extraction of Data-Points from Scientific Data Charts. It also helps in reconstructing them with the original data values and produce better search results.
Using the tool
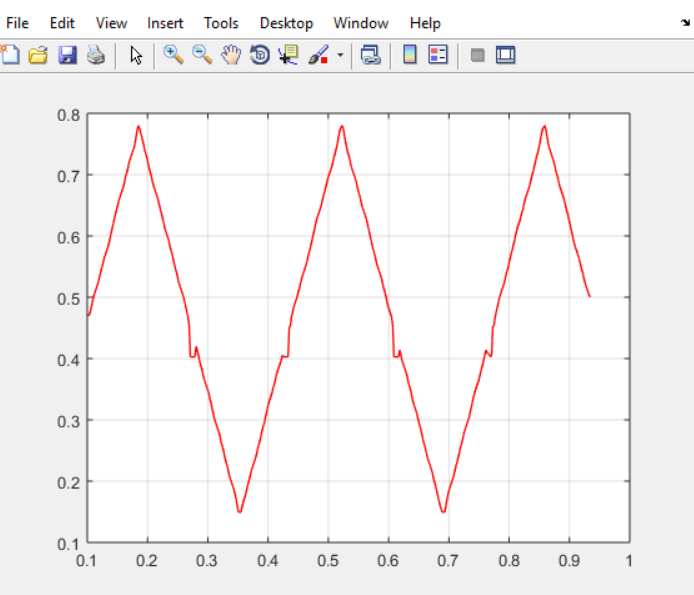
- Once the GUI starts, from the toolbar, select the open image button to select and open the desired chart image. From the toolbar, click on the Reconstitution button. Image Preprocessing will start.
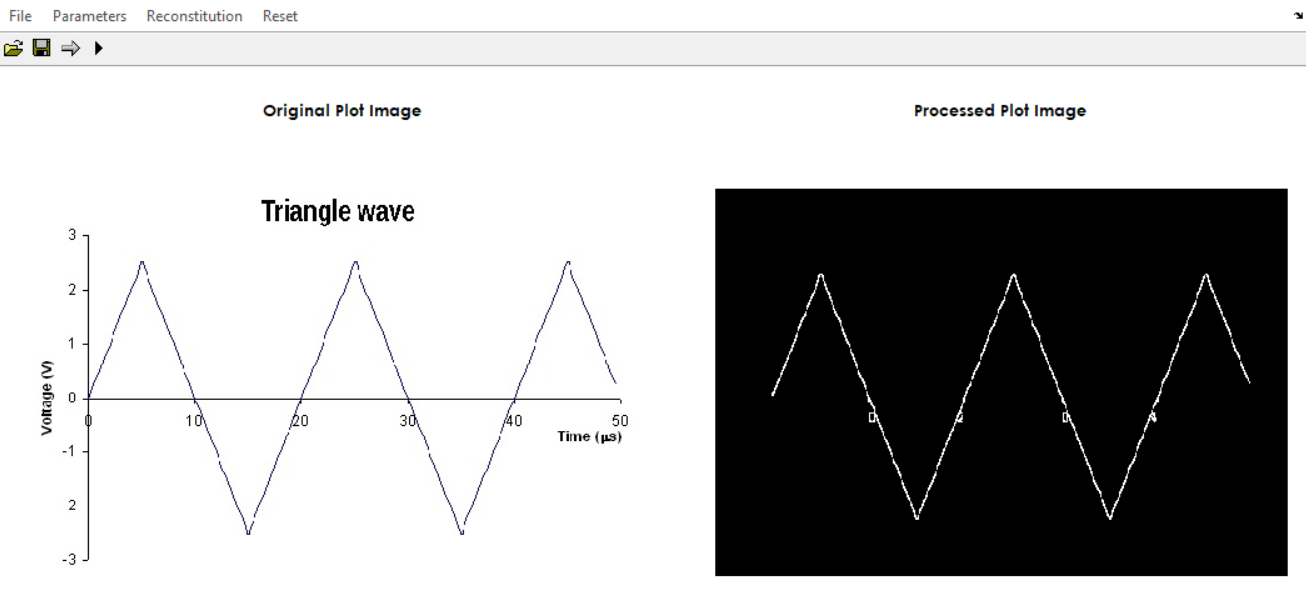
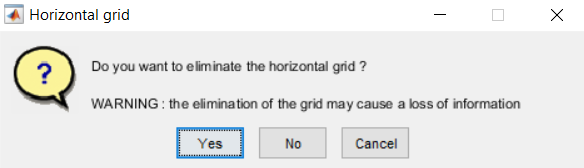
- Application will ask to remove the Grids and other Unnecessary information. Segmented curve will be shown.
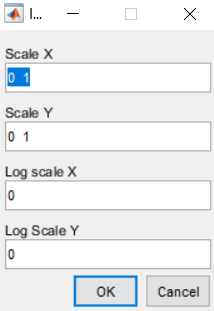
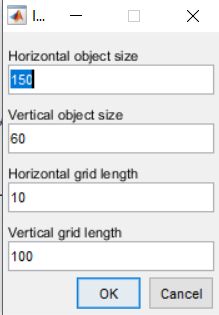
- From the Menubar, select the appropriate Image-Processing and Scale parameters for better reconstitution.
- Now select the option to build the curve from the toolbar. Data Points will be extracted from the plot.
- Finally, click on the save button to save all the data points into a text file.

Tags
MATLAB